|
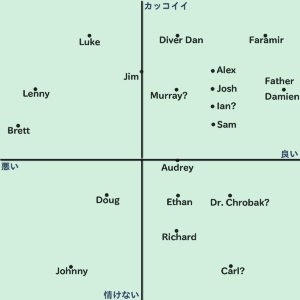
This highly scientific scatterplot chart shows a distribution of David Wenham characters on a two-dimensional
moral plane. The horizontal axis represents good and evil, while the vertical axis represents "wretchedness" (defined,
apparently, as social status). This gives us four character archetypes:
-
The "Lenny" = low morals, high status (evil, wealthy)
-
The "Faramir" = high morals, high status (good, aristocratic)
-
The "Johnny" = low morals, low status (criminal, marginalized)
-
The "Carl" = high morals, low status (honest, poor)
(I think that's how it's organized. The Altavista translator rendered the graph explanation as "the
kana which how the potato will be located." For all I know, this could actually be a chart showing how many french fries
are consumed by each character.)
Notice that the character points are scattered all over the chart, thus confirming David's range and talent.
A less versatile actor's points would all be concentrated in one area. This chart proves mathematically that we
are in the presence of a fabulous actor.
It originally appeared on a Japanese fansite.
High
Status
/\
|
|
|
|
|
|
\/
Low
Status
Evil <--------------
--------------> Good
|